V85 Model Lab
Forecasting against a market that's hard to beat.
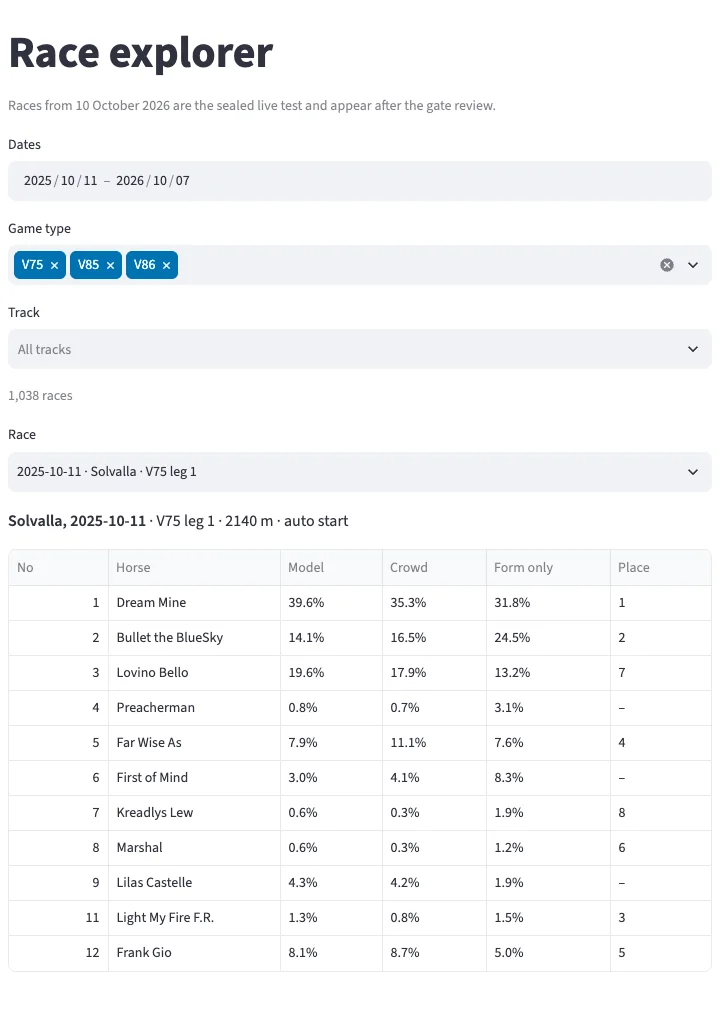
Every Saturday, Sweden's biggest trotting game, V85, asks you to pick the winner in eight races. I built a system that estimates every horse's chance of winning, compares it with how the crowd bets, and tests it like a trading model: no peeking at the future, and an uncertainty range on every number.
The Model Lab may take a few seconds to wake up.
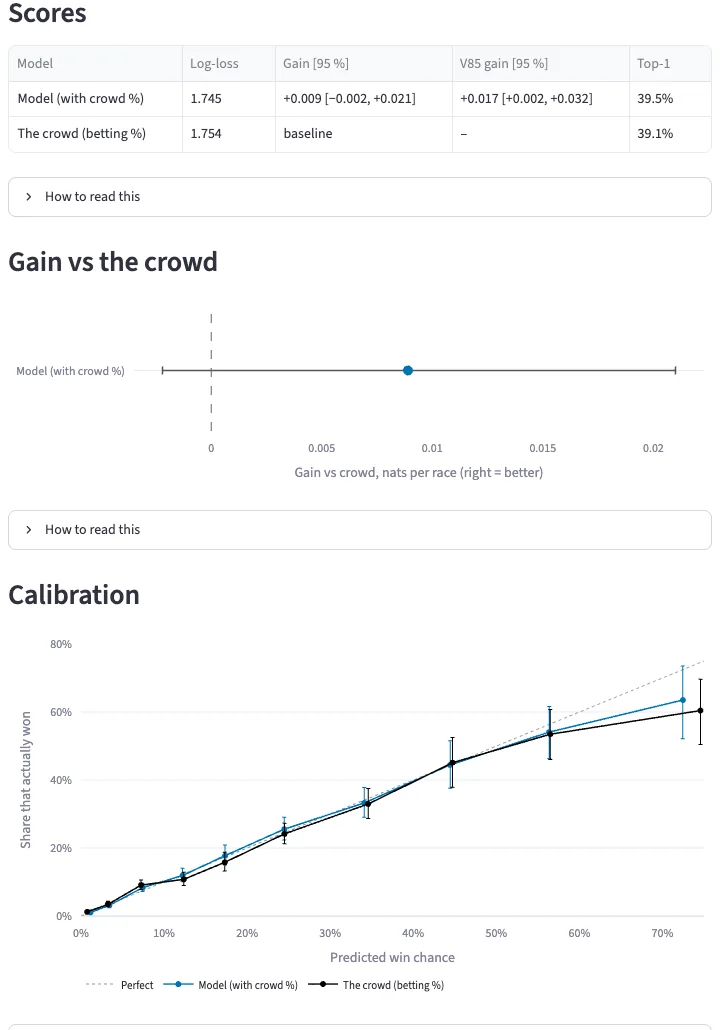
better than the crowd at pricing V85 winners, on 600 V85 races. 95 % range +0.1 % to +1.8 %.1
walk-forward, 11‑Oct‑2025 to 7‑Oct‑2026, on 130 race days, with no peeking at the future.
Below 1 means the crowd overbets them. 95 % range 0.74 to 0.91, on 1,038 races.1
Read with care. The backtest uses the crowd's final betting %, which a prediction made before the betting stop cannot see, so these numbers are optimistic. The sealed live test below is the honest check.
What I found. The crowd is good, but it has a habit.
The crowd is hard to beat.
A model that sees only form trails the crowd's betting %: its gain is −10.9 % (95 % range −13.3 % to −8.4 %, on 1,038 races).
But it has a habit.
The crowd bets too much on favourites. Correcting that gives a small, measurable edge on V85.
The backtest is optimistic.
It uses the final betting %. So every round from 10‑Oct‑2026 is a sealed live test, and since 17‑Oct‑2026 each round's prediction is published as a hash before the betting stop.
The result so far. Small, but the range stays above zero.
Gain against the crowd, added up race by race. Above zero means the model priced the winners better.
Read with care. On all 1,038 races, V86 and V75 included, the gain is +0.5 %, 95 % range −0.1 % to +1.2 %: smaller, and the range includes zero.
The live test. Sealed before every round.
Since 17‑Oct‑2026, each round's prediction is hashed once and pushed to GitHub 15 minutes before the betting stop, then revealed after the round, so anyone can check it was fixed in advance.
So far: 1 sealed round, 8 races. That is too few to tell; a 95 % range comes after 4 rounds.